This past weekend, ten University of Windsor Computer Science students took up the challenge of the HackWE Code Jam: use the City of Windsor's set of Open Data to create an interesting app. And that they did:
"Using GPS data provided by the city, Gagnon and Chernoukhov created Windsor Garbage Zombies, an augmented reality game that lets residents battle the undead while actually moving through the city. The zombie hordes spawn at schools, and players can heal themselves or pick up supplies by visiting local hospitals". [Metro: Garbage zombies and open data dominate Windsor’s first hackathon]
"Chris Drouillard, Alex Velazquez, and Kevin Yavno won for technical achievement. They were able to create an application that works on desktop computers and phones, visualizing city data sets like ward boundaries, sidewalks and bike trails on a map. Their application also shows detailed information about locations within the city as reported by city data sets. They won because they were able to do an incredible amount of work and created a highly polished application in just 24 hours. As of this posting, you can check out “Winfo” on Chris’ web space." [Doug Satori: HackWE]
The hackathon was the result of lots of good folks coming together including WETech Alliance, who organized the event, and St. Clair College, The City of Windsor, The University of Windsor, The Trillium Foundation, and a group that I'm involved with, called Hackforge.
I was unable to make the event, so to make up for it, I thought I'd present some more Open Data to the (re)mix:
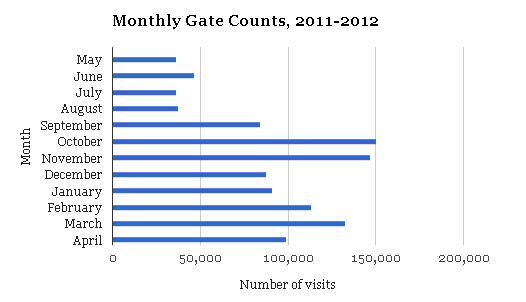
Some libraries offer "dashboards" of interesting institutional statistics. Other libraries like The Edmonton Public Library offer open data sets. We're offering both!
.... Introducing the Leddy Library Dashboard of Open Data and Statistics! Please take a look and if you are so inclines, let us know what data sets you are interested in seeing next.
Connect with your library