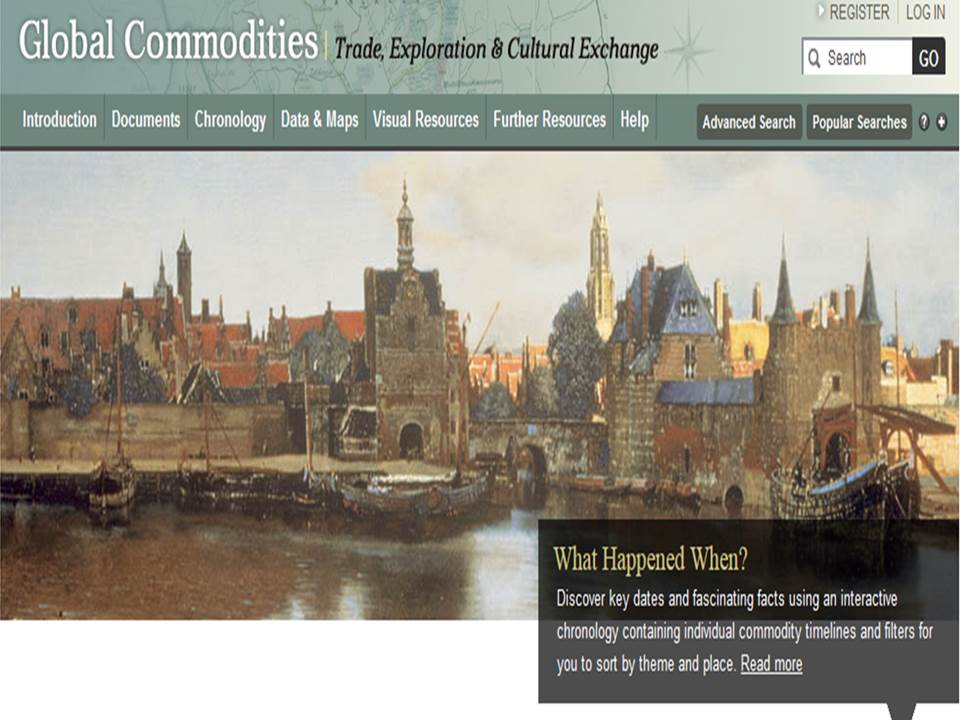
Global Commodities Trade, Exploration & Cultural Exchange contains resources on the history of key commodities that have been exchanged and consumed around the world for hundreds of years. In addition to Interactive Charts, Maps and Data this resource include wide range of primary-source materials such as Original Records, Photographs, Maps and Advertisements.
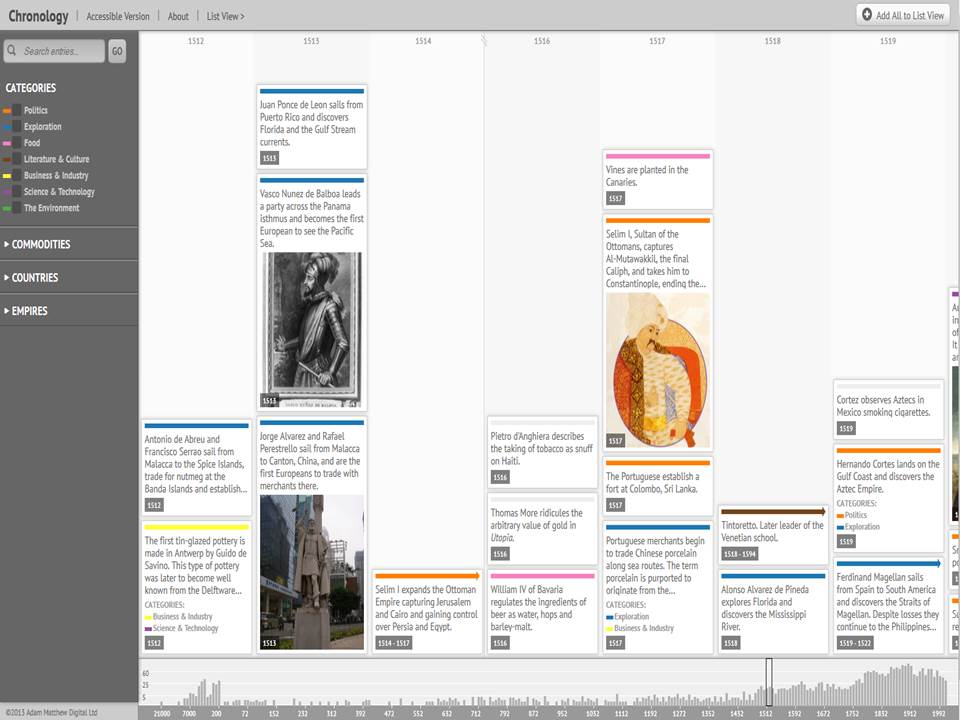
Chronology
One nifty feature of Global Commodities is the interactive chronology. This feature allows you to chart the production, movement and use of raw materials and products since ancient times to the present day as well as other important historical events.
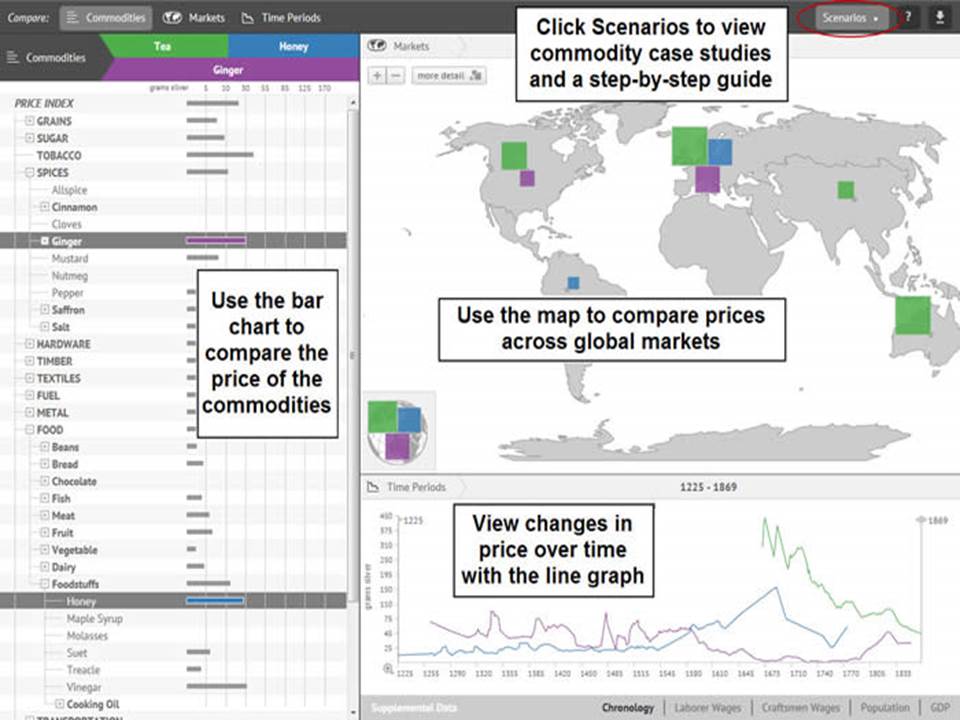
Price Data Visualizations
The data visualization tool allows you trace the price of a wide range of commodities over hundreds of years and multiple global markets. Supplementary data also enables you to compare the prices data to wages, population and GDP while entries from our chronology provide additional background information and context
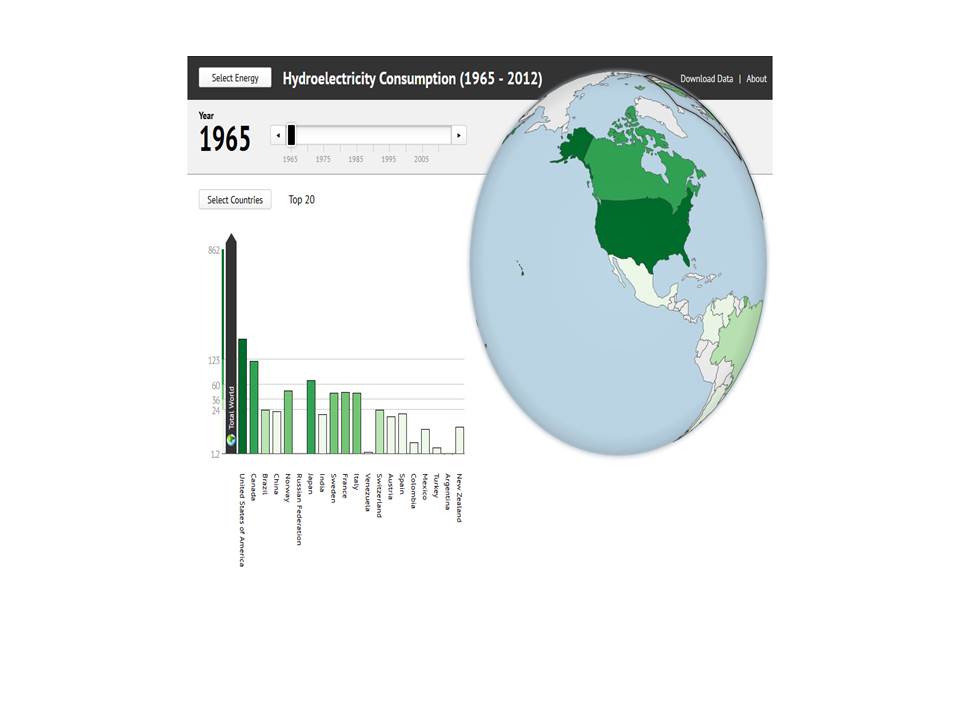
Energy Data Visualizations
This tool visually presents energy data. Data can be filtered in a number of ways (different types of energy production/consumption for All countries, G8, OPEC or Non-OPEC countries). Results are projected against an interactive bar graph and globe.
Maps
Global Commodities Trade, Exploration & Cultural Exchange also has both historical and interactive maps that allow you to explore information related to global commodities, trade and exploration in a clear and engaging format.
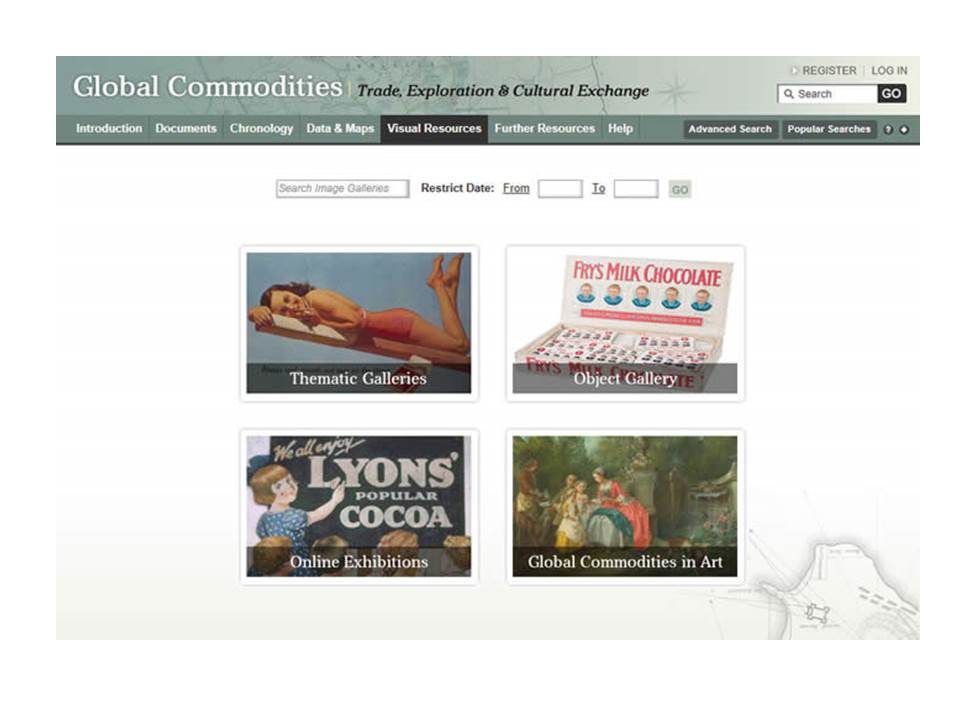
Documents and Visual Resources
In the Visual Resources section you can view photographs, artworks, advertising materials and Ephemera.
Connect with your library